From Google to AI: Debugging Errors with Context

Alex Garrett-Smith •19 February 26
A clear shift has happened from searching Google (which, let’s be honest, almost always led us to Stack Overflow) to debugging with AI. Provided you pass relevant context, AI can solve even the most complex issues in a fraction of the time.
We’ll dive into this historical shift, and most importantly, cover a few options for your workflow to get the best out of your debugging sessions.
The Old Way: Search and Stack Overflow
You know the old way already. As developers, we’re pretty good at copying and pasting errors into Google and praying that someone else has asked the same question, written a blog post or mentioned a solution in a tiny corner of a forum somewhere.
This method of solving issues was usually effective, but painfully slow. While it provided the advantage of being able to deeply understand the problem and absorb the solution, this came at the sacrifice of hours, possibly days, of manual debugging through trial and error.
There’s no question about the direction this is heading. While we should absolutely appreciate the role Stack Overflow and other platforms have had on our development growth, the sad reality is not many people are using them anymore.
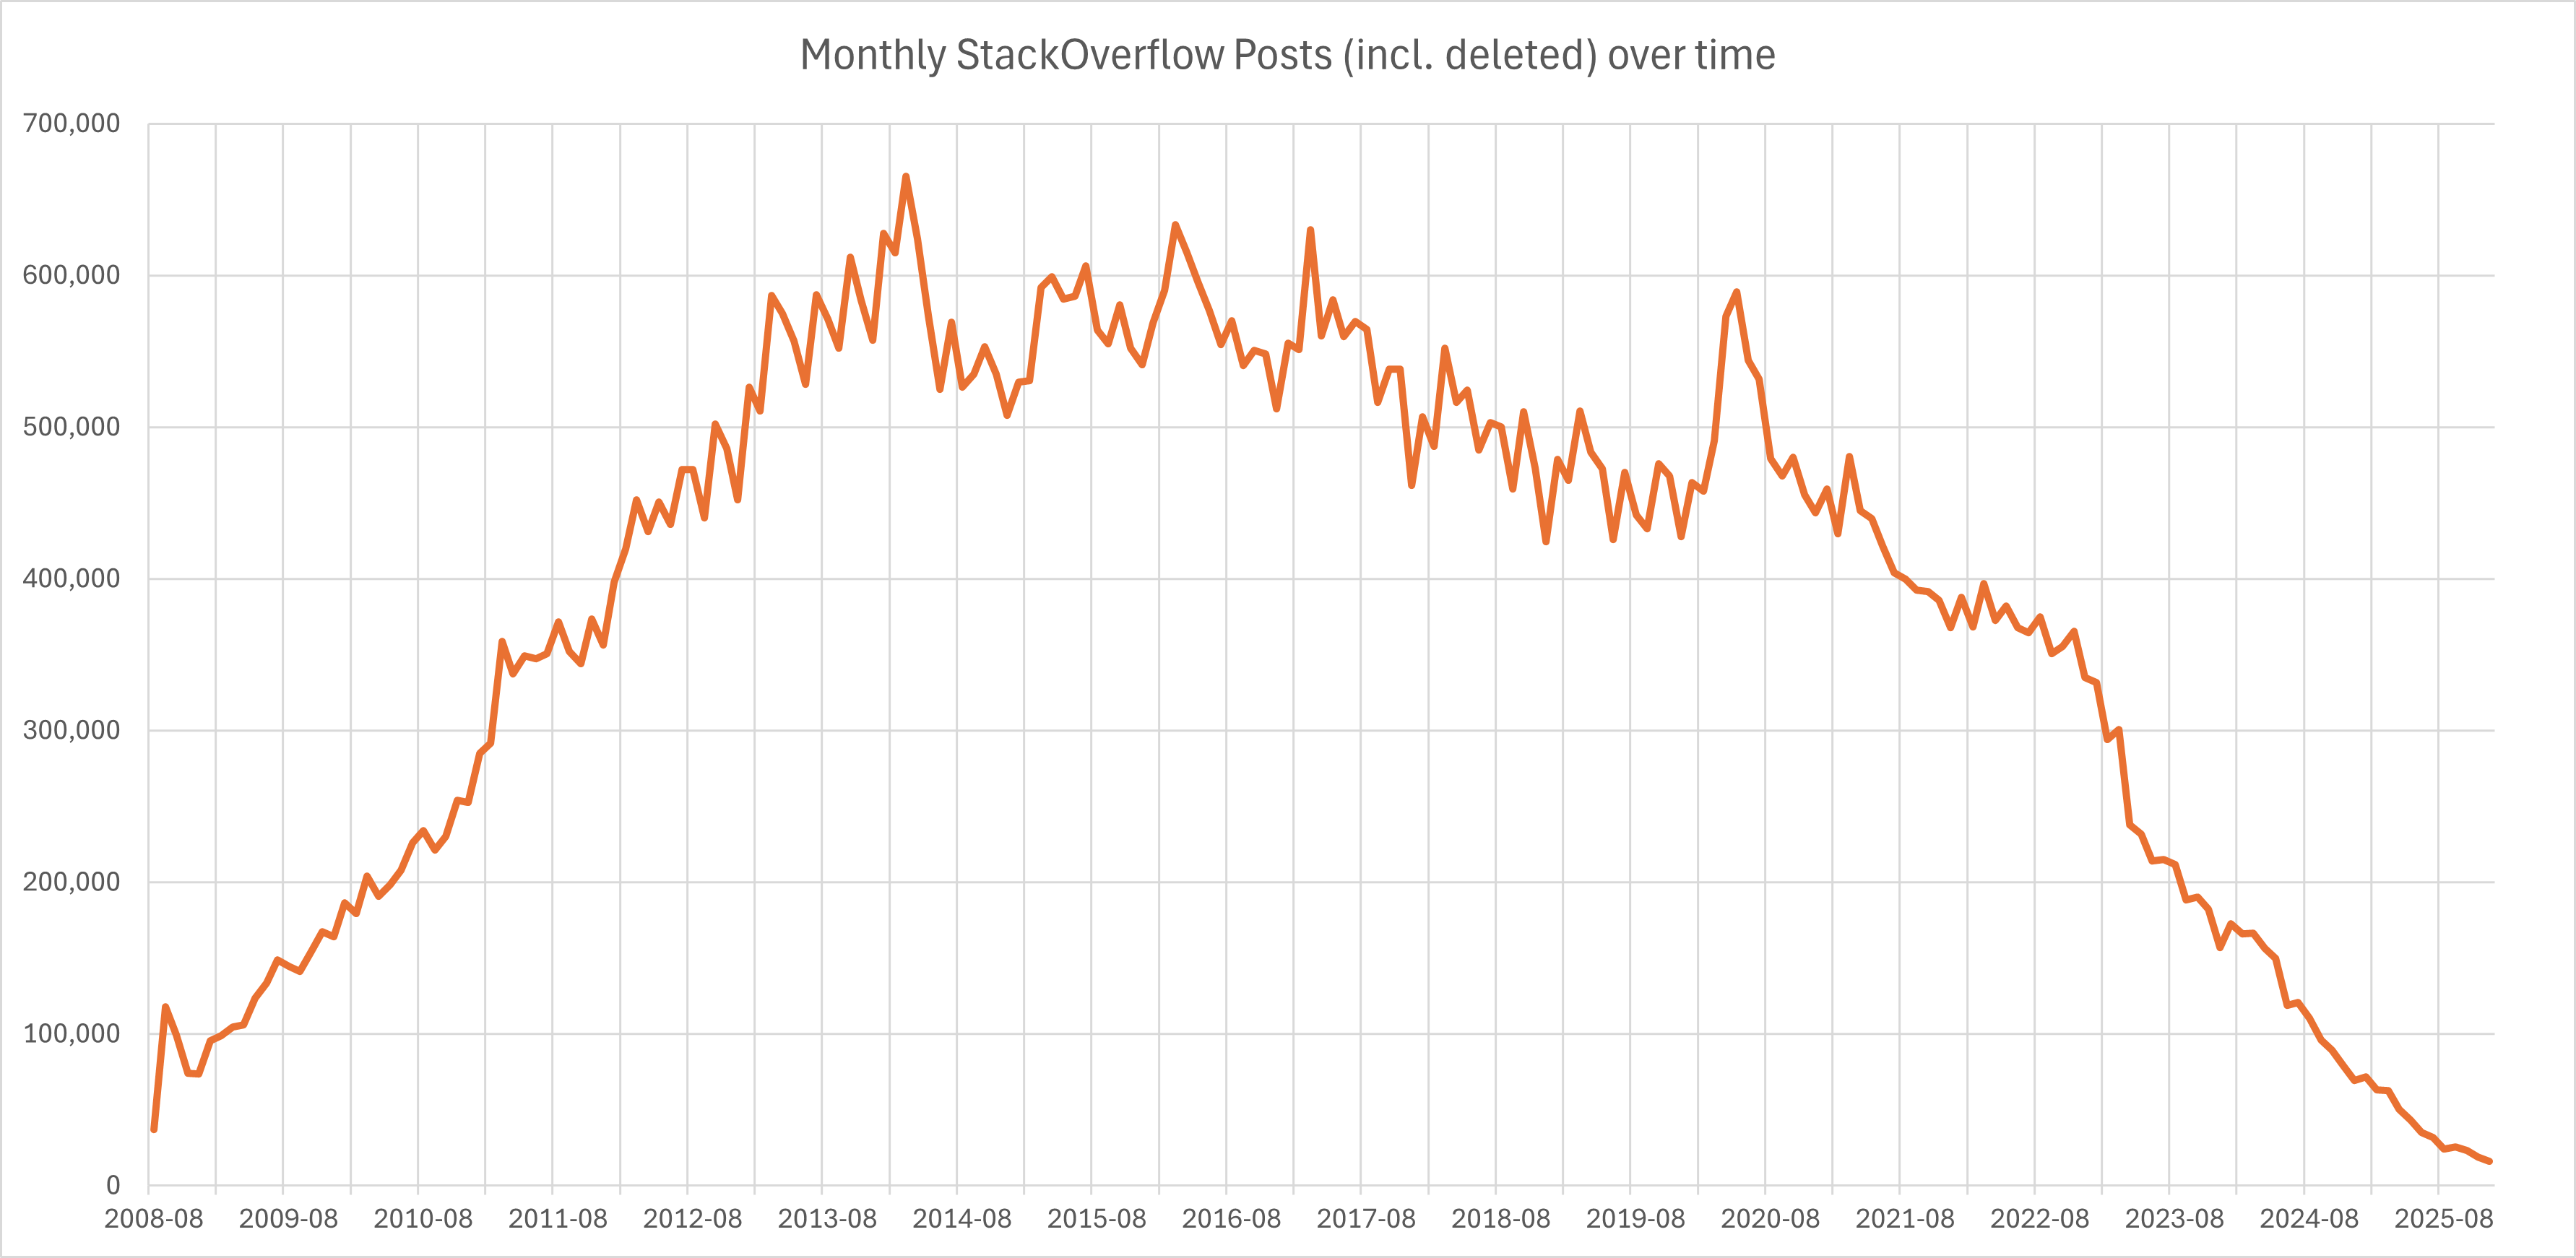
Graph showing new monthly Stack Overflow posts from 2008 to 2025.
So what’s happening here? Well, there’s been a gradual shift in how developers are solving issues, and it starts with chat interfaces.
The New Way: AI-Assisted Debugging
Using LLM Chat Directly
Early LLM chat interfaces (including the first public versions of ChatGPT in late 2022) weren’t originally designed as developer tools or debuggers. They were meant to show off general-purpose conversational intelligence (the ability to explain things, answer questions, write text…that sort of thing).
Slowly, the landscape shifted towards developers experimenting with as much code generation as these early models could handle, and that included pasting in errors (and sometimes code for context) and having the LLM explain what’s wrong, which pretty much always offered a rewritten solution.
I remember the first time I was stuck on a bug and tried this. Years ago this seemed like magic. Today, it’s commonplace. And that’s the first step we can take as developers.
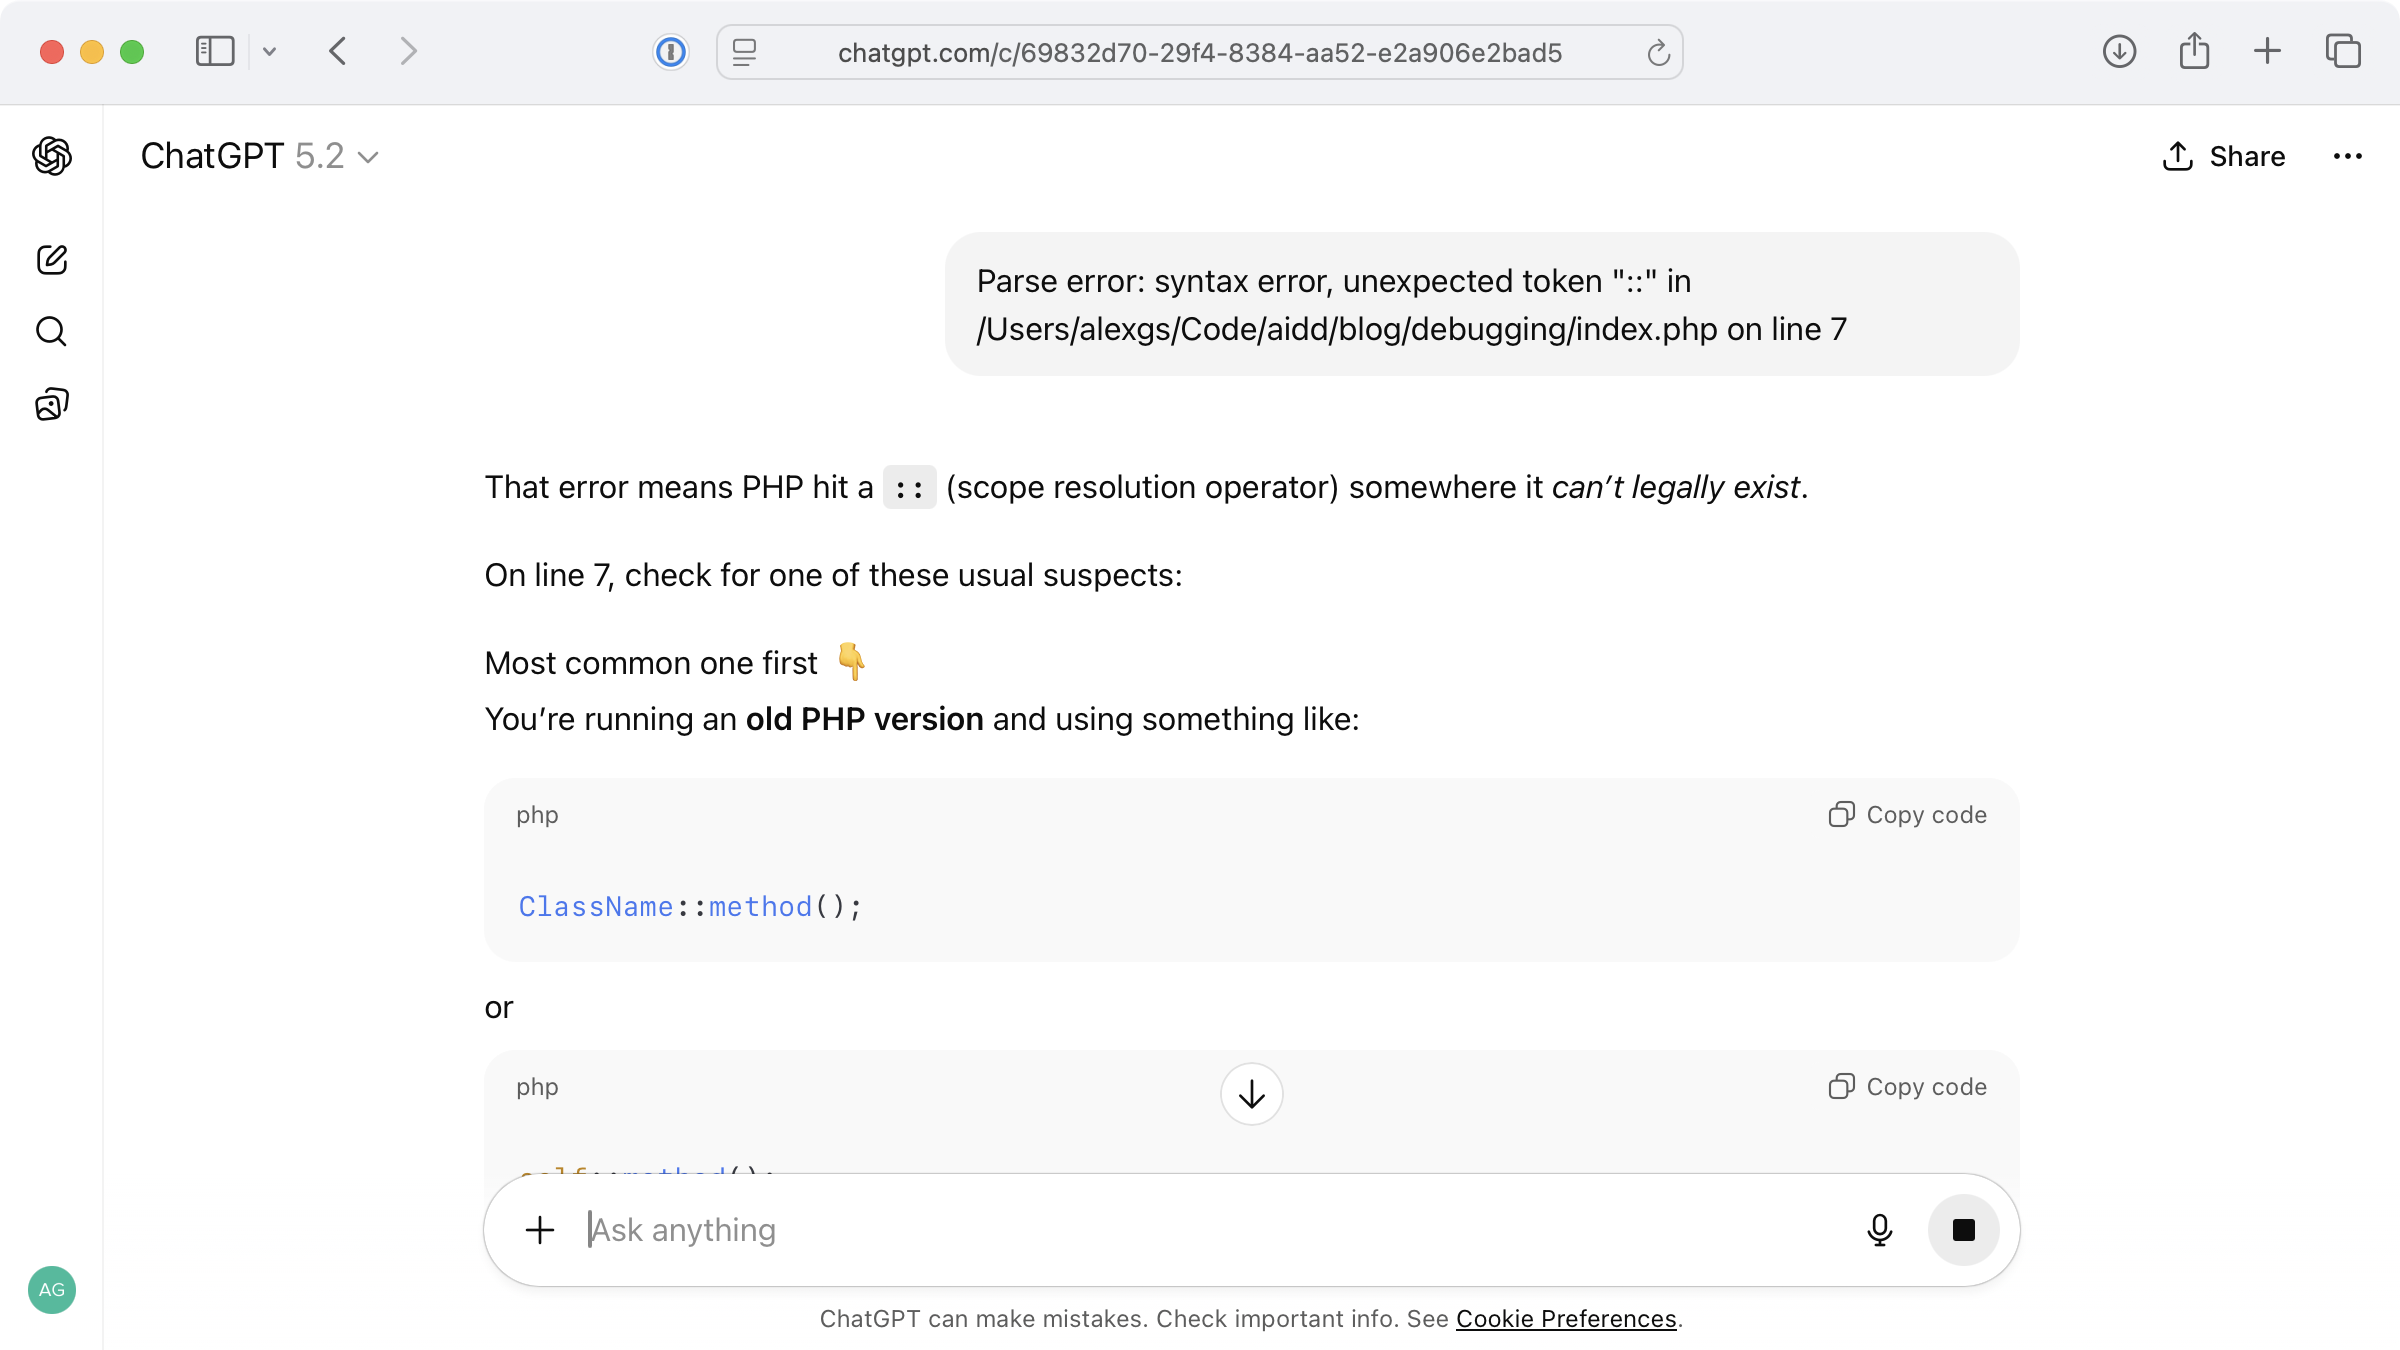
Straight-up pasting of an error into ChatGPT with zero contextual awareness of the codebase.
For simple, generic errors like this, a chat interface works perfectly. A side effect of this method is that it stores the error and solution for later reference.
And if I need to add more context to get a specific fix back? Not a problem. I can continue to iterate on the original context within this chat.
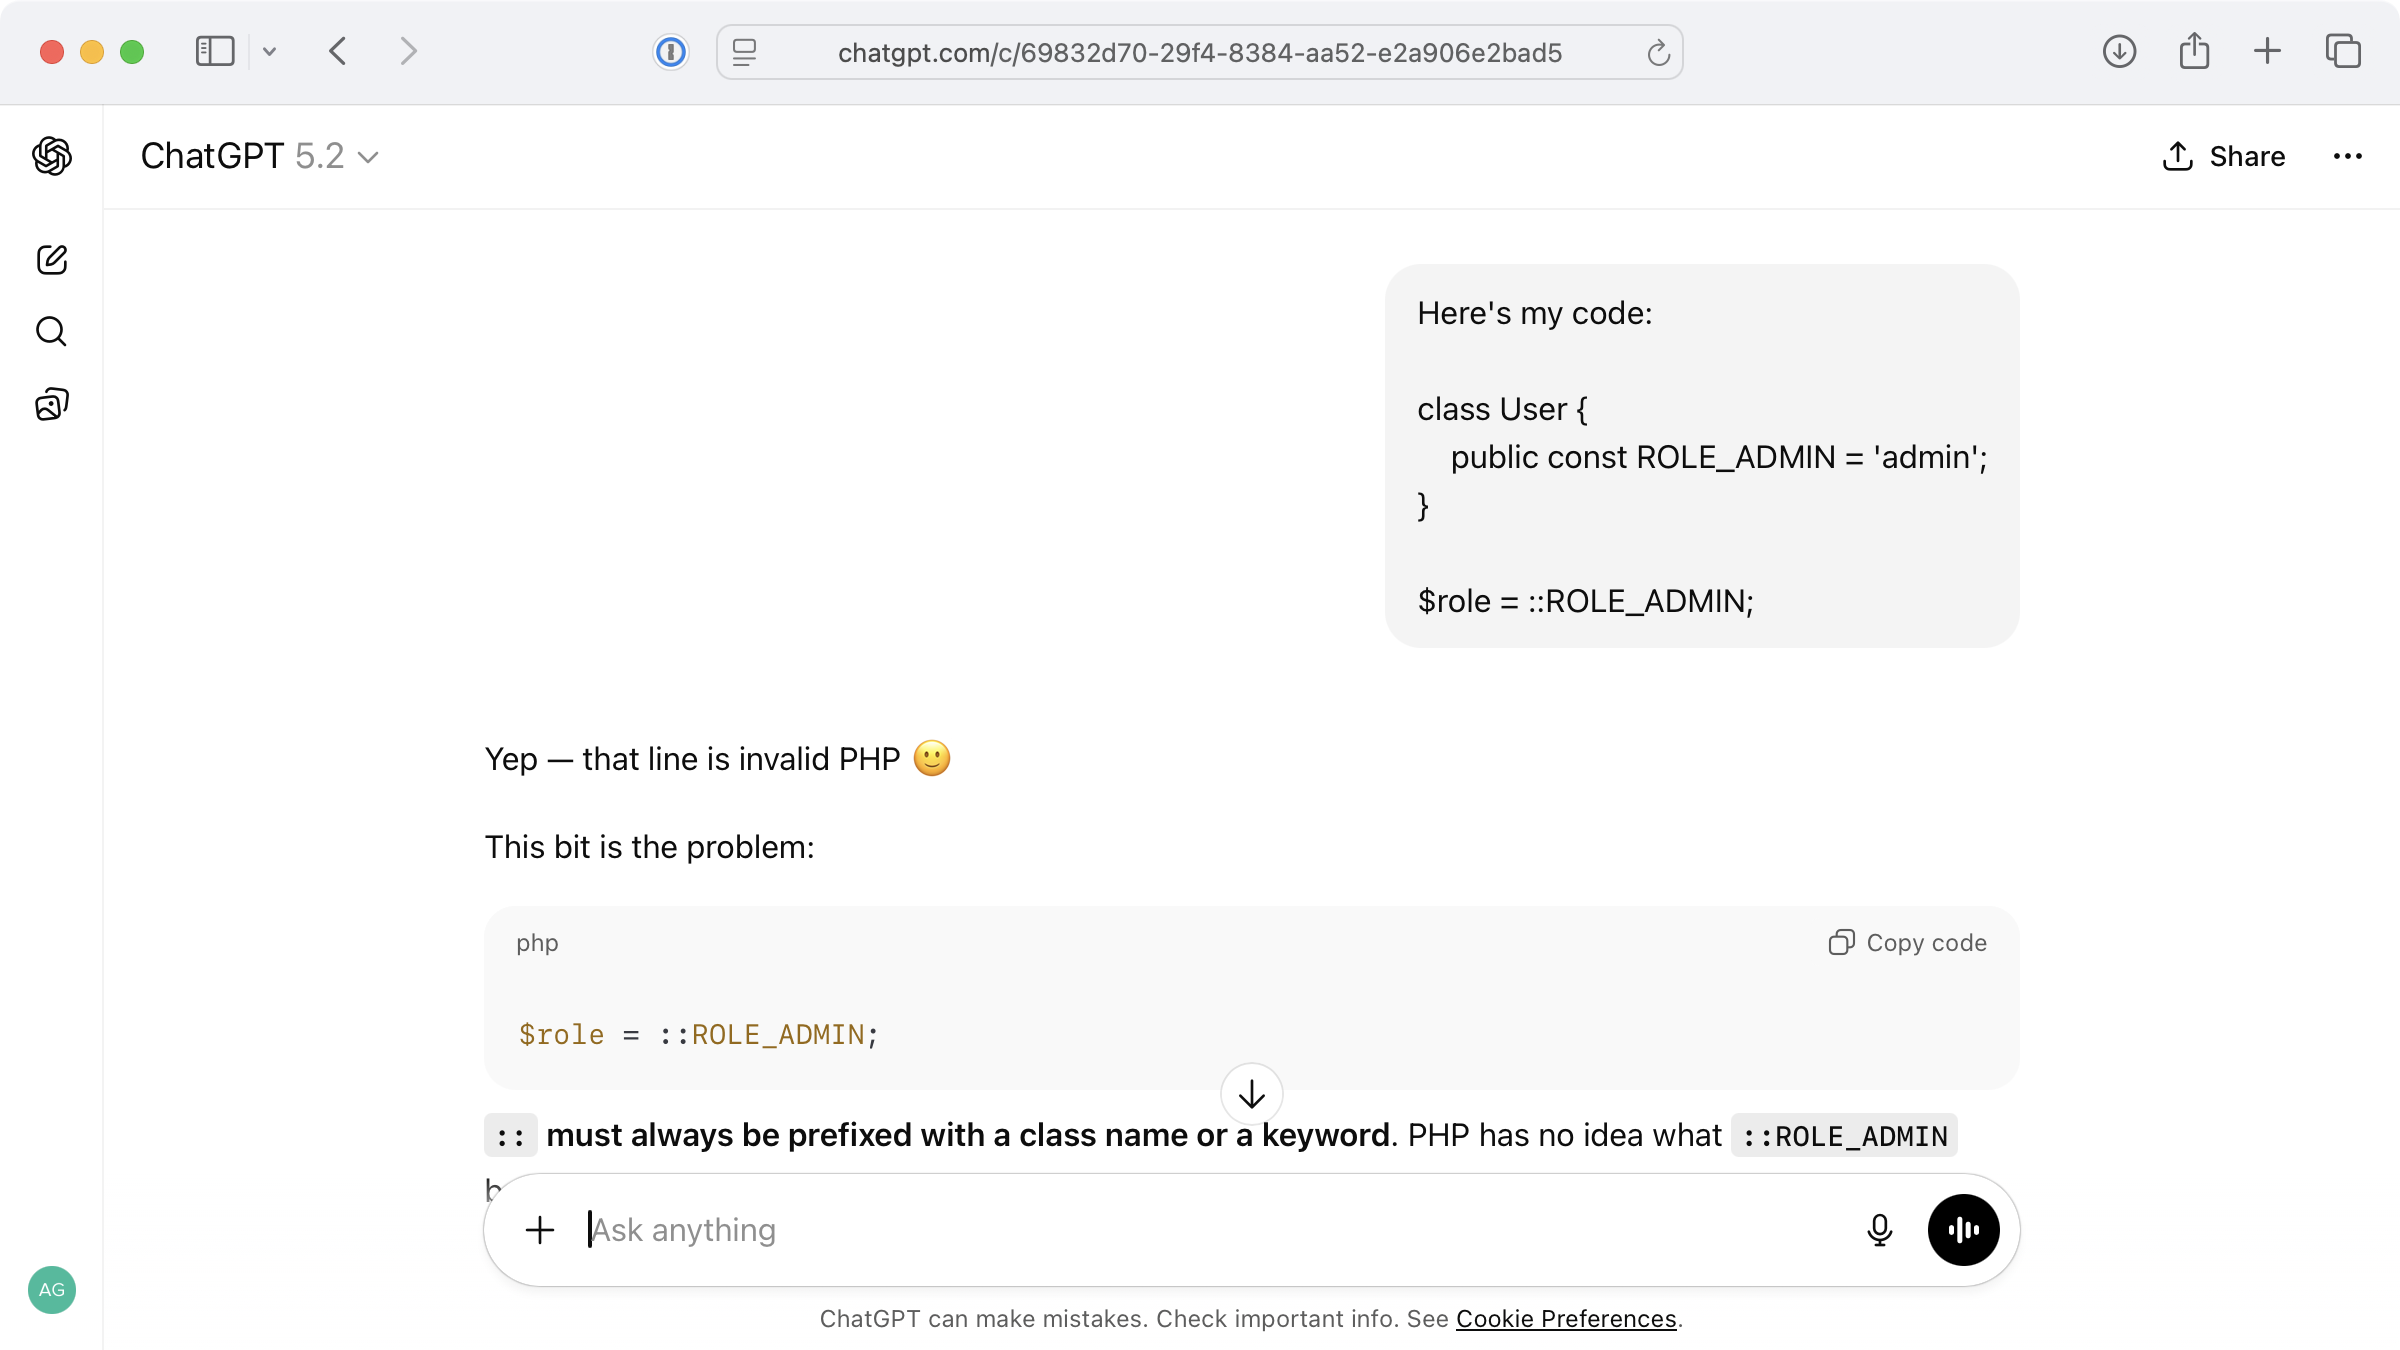
ChatGPT gives me the exact issue for the code I’ve pasted in.
The great thing about using an LLM-powered chat to debug is that it feels more like a conversation and learning opportunity and less like a demand to fix the issue instantly. While sometimes slower, a more conversational approach can help with deeper exploration and better understanding of an issue.
The example above is incredibly straightforward, but for more complex issues where you’d prefer to chat, you can feed in:
What packages you’re using in your codebase (so it can look up how they should work)
Larger stack traces that give an idea of the route through your code before the error occurred
What you expected to happen vs what actually happened
What you’ve already tried
While chat interfaces can be helpful, we’ve already moved towards a better approach of skipping the need to move context from your codebase manually into services.
Debugging with Full Codebase Context
There’s nothing wrong with pasting an error into ChatGPT, Claude or another chat interface and going back and forth until you reach a solution. However, anything inside the context of your codebase is automatically faster at arriving at a solution.
Imagine this: asking a fellow developer “What’s the solution to this error?”, without allowing them to see the codebase. Sure, they’d be able to try and infer what the issue might be, and you might feed them snippets of code to help. In reality though, they’d jump right into your codebase and take a look!
The benefits of allowing AI access to your codebase like you would a fellow developer are:
AI can analyse all code within your codebase
It understands your project structure
It can suggest fixes that fit your existing project architecture
Automatic error detection and explanation (yes, before you spot them).
First up, with an AI-enabled IDE like Cursor, you’ll find autocomplete and inline feedback so good you’re unlikely to re-create bugs as I’ve demonstrated here.
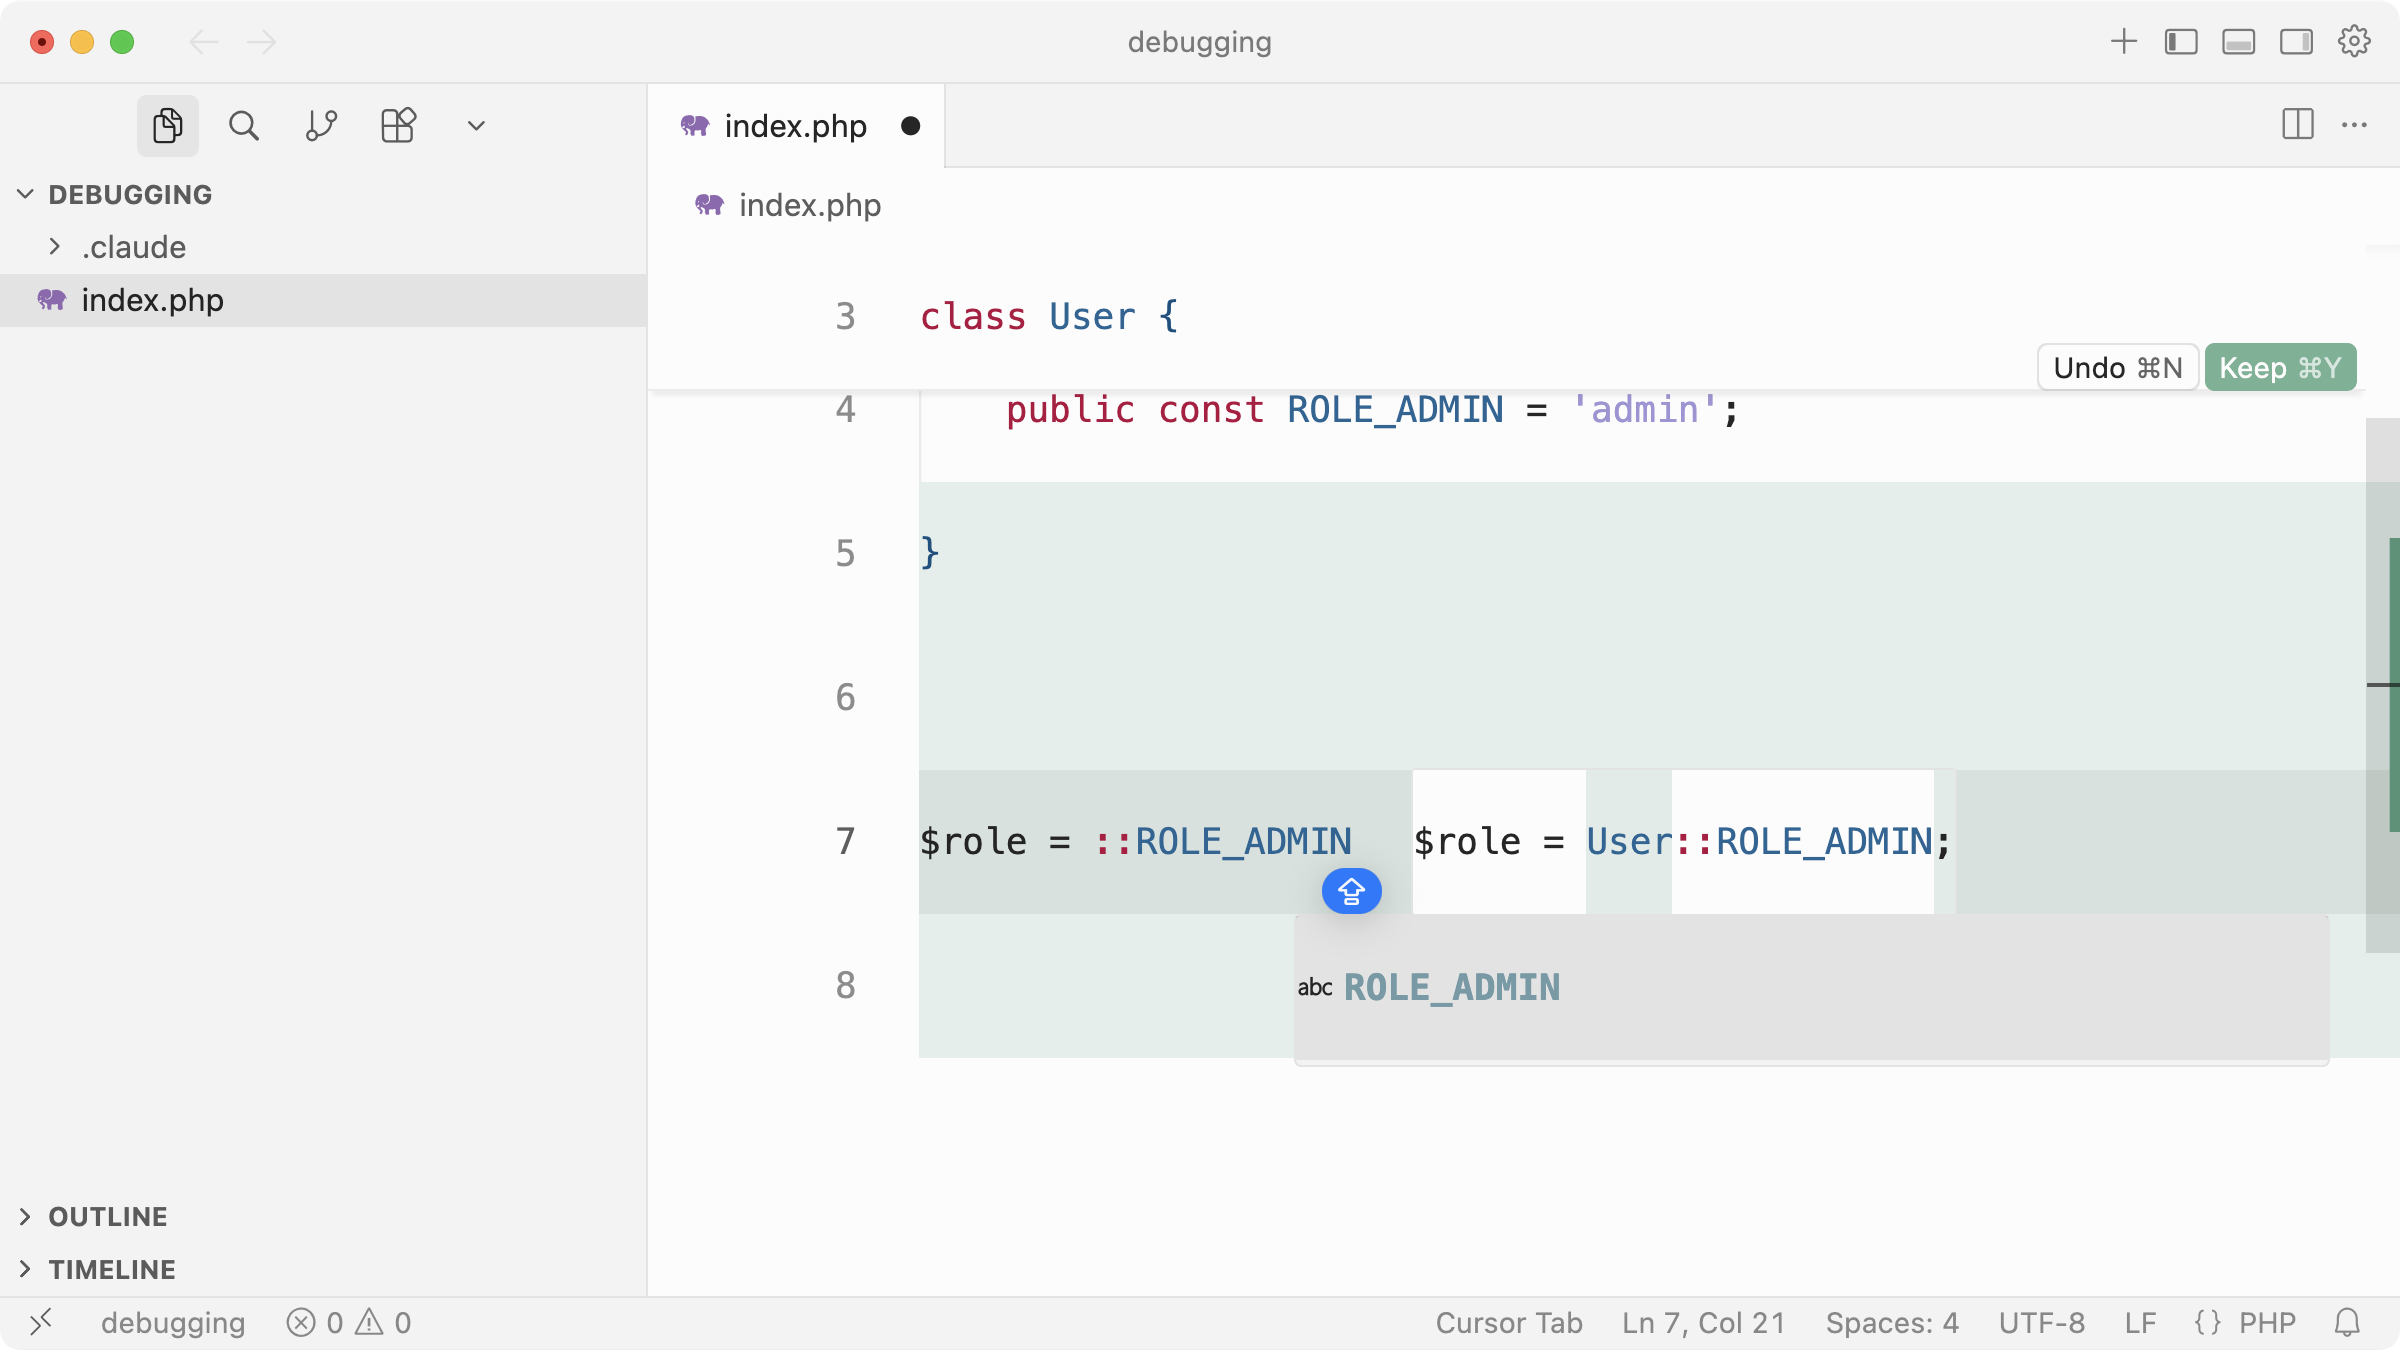
However hard I try, Cursor almost forces me to tab to implement the correct solution.
But, for more complex bugs that touch multiple parts of your application or produce a logic error, we can ask Cursor to investigate and give us some pointers.
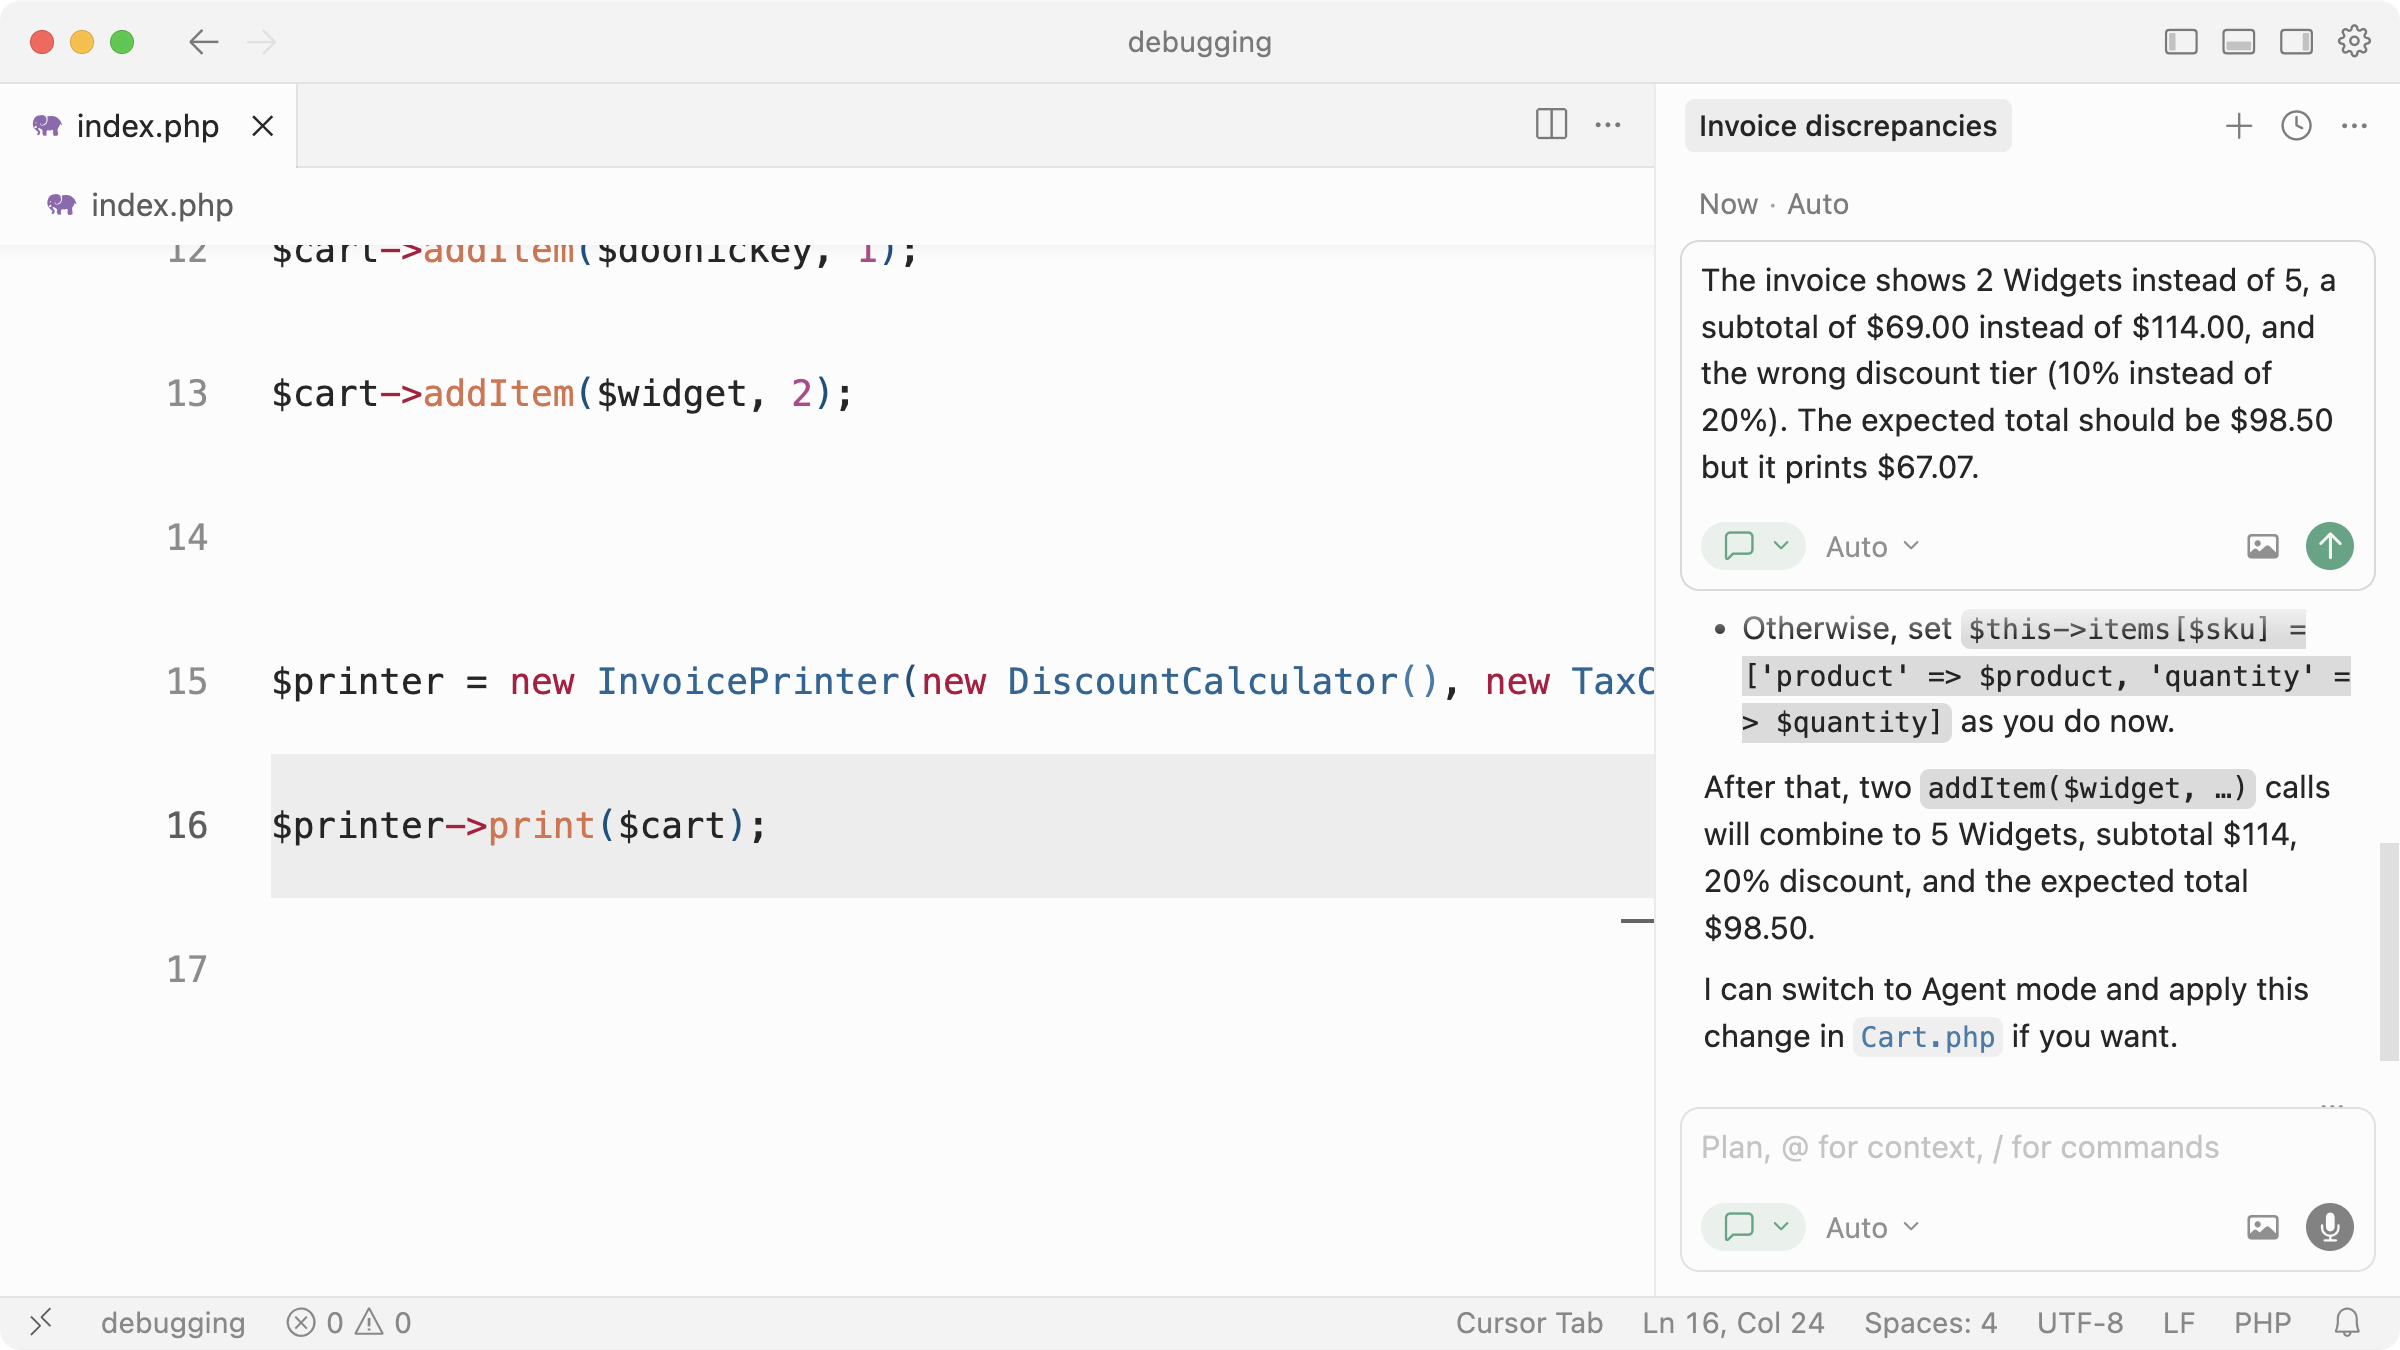
I describe a logic bug, Cursor investigates, tells me the issue and offers a fix (if we switch to Agent mode).
The possibilities are endless. You might, for example, integrate Chrome DevTools MCP to allow coding assistants to debug web pages directly in Chrome by physically opening them, verifying changes are correct and interacting with the page.
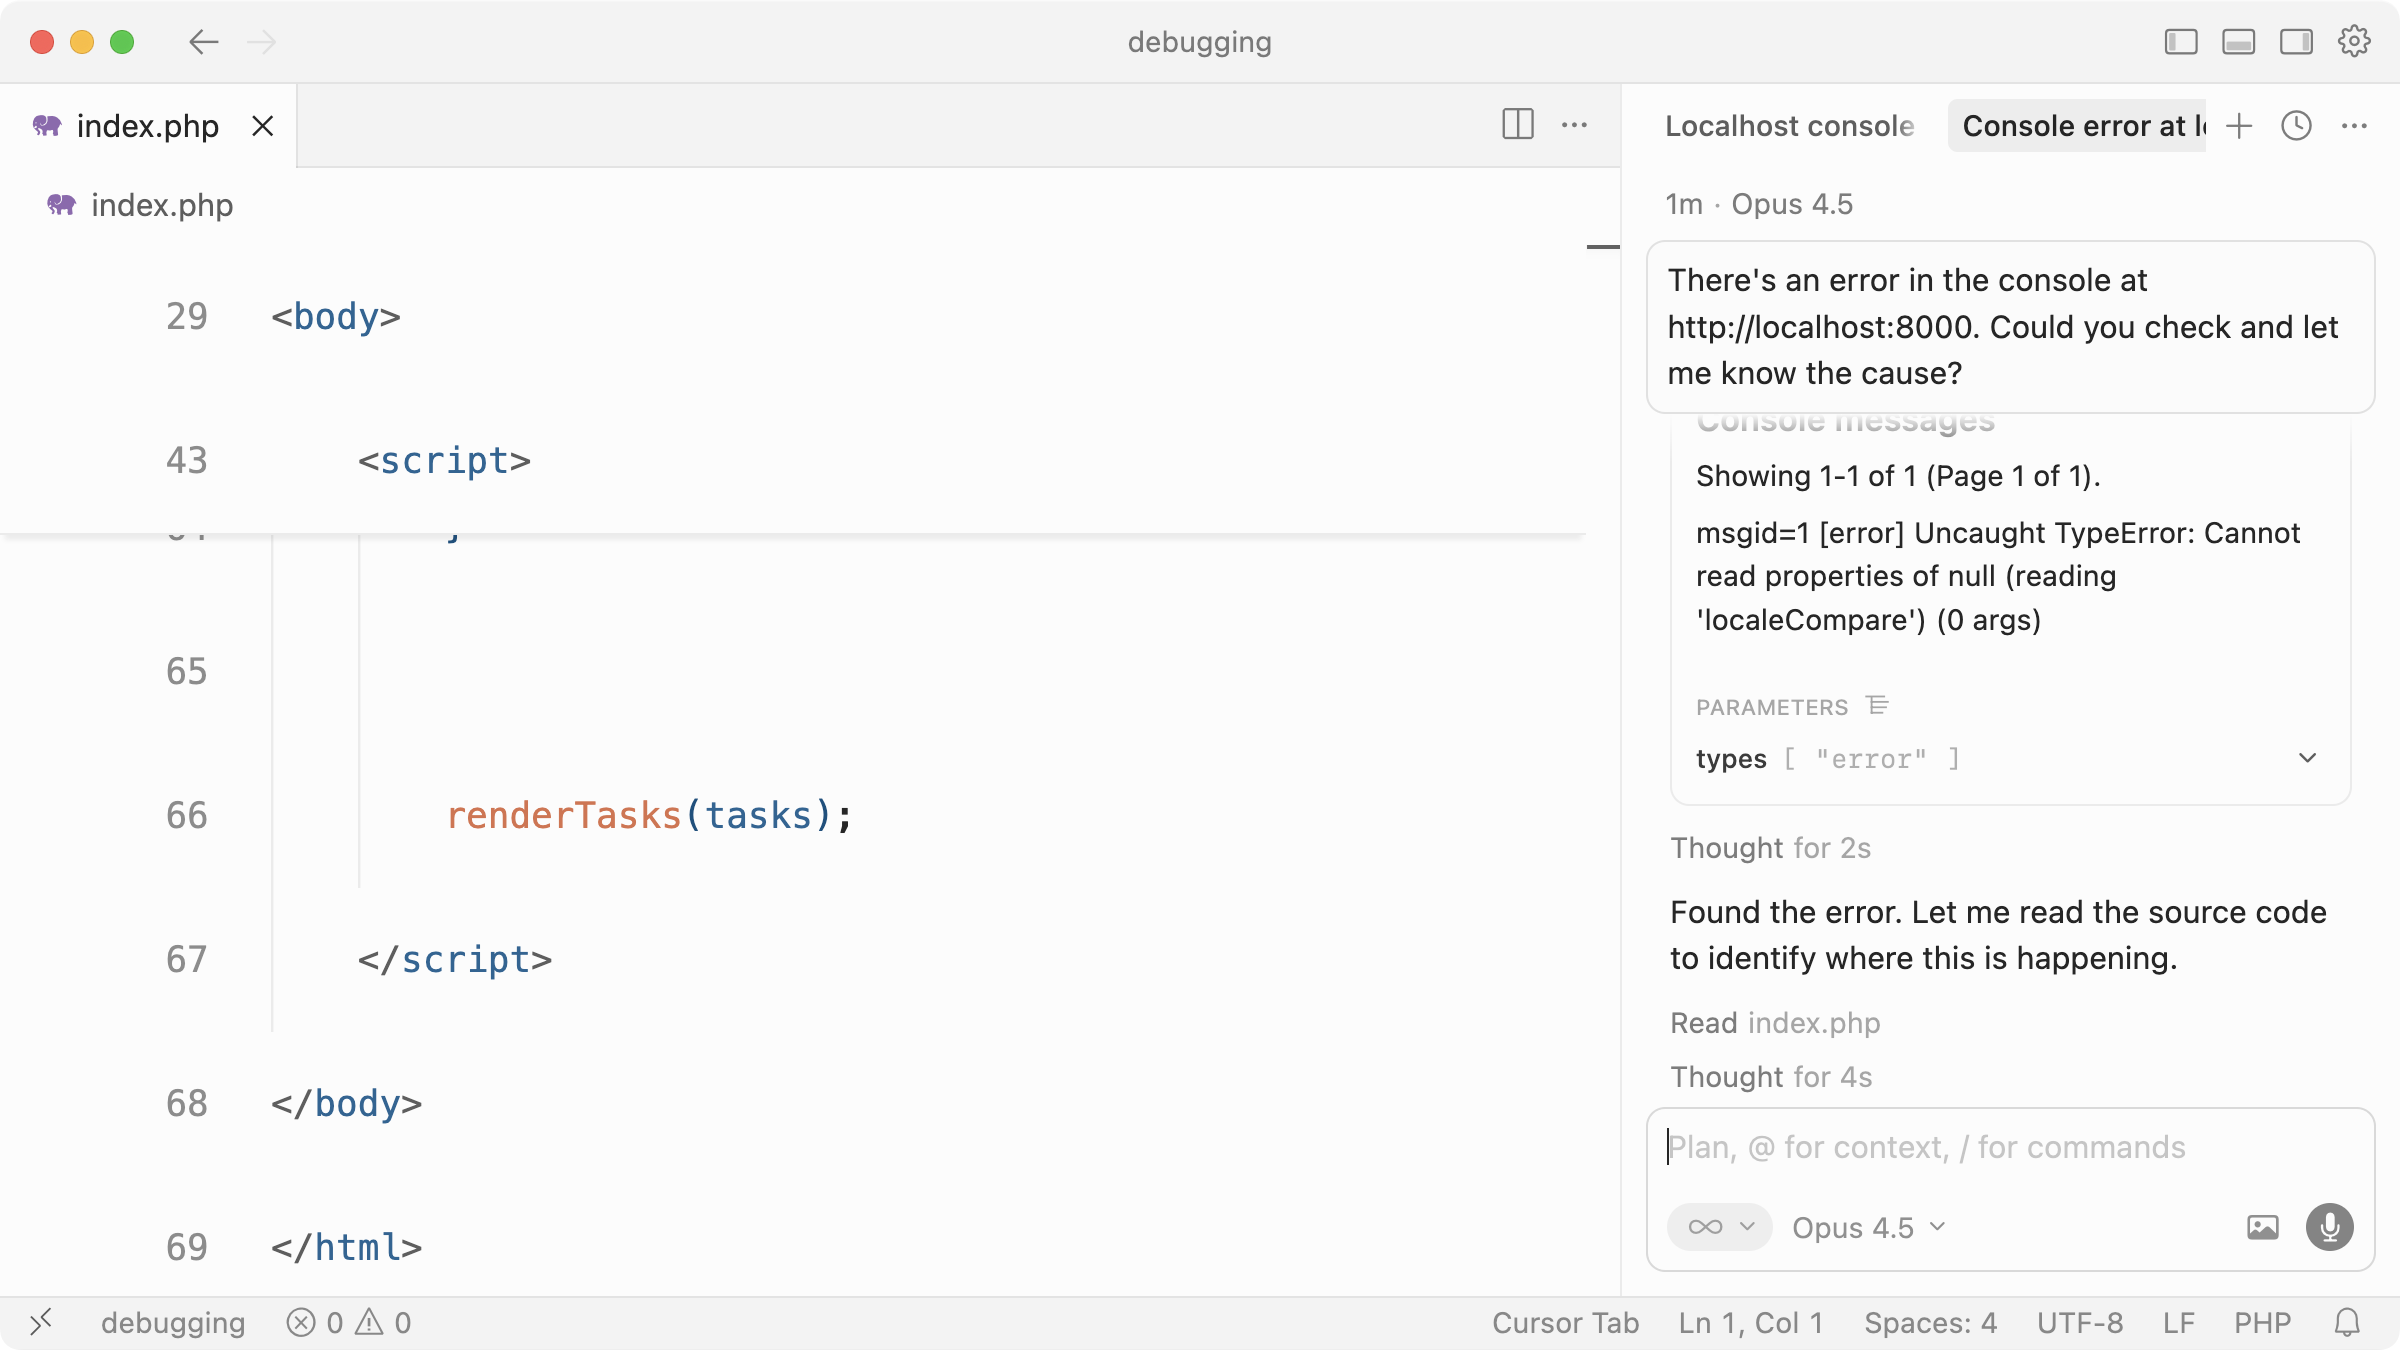
I ask Cursor to check the server at localhost:8000. It uses Chrome DevTools MCP server to open a browser, read the console, and report back with the error.
Cursor then asks me… “Would you like me to fix this?”. Perfect.
Downsides to Having Full Codebase Context
Unfortunately there are no perfect solutions, and AI-assisted debugging with your full codebase context can have some downsides if you’re not careful.
The first is cost. While IDEs like Cursor allow you to ask a question and control the context (the files, basically) you send, you’re still likely to end up using more tokens (and therefore money) than pasting snippets of code into ChatGPT on a predictable paid plan. Asking Cursor to solve a bug and loading in almost your entire project every time is wasteful.
Second is context dilution (aka. attention tax). When you give a model a whole project, you’re betting it will notice the right things, which isn’t guaranteed. Large contexts increase the chance it anchors on irrelevant files, outdated code, or abstractions you’ve added but aren’t currently touching. With a pasted snippet (or by being really selective over which files you want an LLM to examine), you’re forcing focus.
CI/CD Integration
Of course, none of this matters if it’s not automatic and easier to spot and fix bugs, so consider debugging as part of your workflow both locally and within your CI/CD pipeline.
As you and your team push up to source control and deploy to production (or staging), you ideally want these things to happen:
Failures captured automatically
Relevant context gathered (logs, stack traces, etc.)
A generated AI summary of the issue
Actionable next steps
An optional fix proposed
If you have a solid pipeline in place from the start, you can use AI to mitigate errors landing in production before they affect real users. When bugs do inevitably end up in production due to edge-cases, your pipeline should be able to detect, alert, and suggest fixes. In some cases, depending on the service you use, they can even create pull requests to automatically fix issues and provide a summary of what went wrong and why (more on that soon).
There are some great tools and services that can help with this, which we’ll look at next.
Tools for Debugging with AI
If you didn’t already, hopefully you now understand the benefits of debugging with AI and have a good idea of how to move forward. At the time of writing, here are some tools I’ve been experimenting with and using to assist in debugging efforts, from small issues to larger, complex debugging sessions all the way through my workflow.
Remember, new tools and services pop up regularly so always be on the lookout for the best ways you can integrate debugging into your own workflow.
ChatGPT/Claude (or any chat interface)
We’ve covered this, but it’s my first step for simple, low-context issues with clear errors to paste in. Although AI-enabled IDEs can also be conversational, I prefer chat interfaces when I want more of a conversation around a very specific issue and have small snippets ready to discuss. It’s also great for keeping a history log so you can jump back and pick up the conversation or reference a past issue.
Claude Code
I use Claude Code almost exclusively for code generation and have Cursor open for inline edits and other features, but I’ve found myself asking Claude Code to debug issues more frequently. For example, I’ll prompt “For some reason TaxCalculator isn’t storing the given currency” and it’ll investigate within a more narrow context. While it doesn’t feel as naturally chatty, it’s still great for conversational fixes and back-and-forth exploration.
Chrome DevTools MCP
We covered this too, but it’s invaluable for figuring out issues directly in the browser. Once you have it set up in Cursor, Claude Code, or anywhere else, you can ask it questions like “Why does submitting the registration form fail after entering an email address?” or “How did that console error happen?”.
Playwright MCP
While there is some overlap between Chrome DevTools MCP and Playwright MCP, I’d lean on Playwright MCP for UI testing and browser automation (more complex flows like clicking, form filling, and full workflow testing). For example, you could use Playwright to verify that a card is draggable between two columns of a Kanban board service you’re building, right after Claude Code implements the feature. It shines at these kinds of complex interactions.
Bugbot
Once you’ve hooked Bugbot up to your source control, you’ll get an automatic code review, focusing mainly on bugs, on every push. I love Bugbot’s simplicity, and I’ve found its feedback to be concise and to the point, so I can easily identify if I’ve introduced a bug. Having a service like Bugbot run as part of your workflow is invaluable whether you’re working alone or as part of a team.
CodeRabbit
Think Bugbot, but a full-on senior developer code review assistant. CodeRabbit integrates directly with your repositories to perform code reviews, spot bugs, and suggest concrete fixes. CodeRabbit has a lot more configuration options behind the scenes so you can tweak it to your team’s preference. Oh, and you can chat with it directly inside the PR by mentioning it.
Sentry Seer
Once your application is in production, bugs will happen. If you’re not familiar with Sentry, it’s an application monitoring service that recently introduced Sentry Seer. Sentry Seer integrates into Sentry’s UI and allows you to analyse bugs, find solutions and even create pull requests…without leaving their platform. If you wanted to invest in possibly the fastest way to catch and fix bugs in production, give it a try.
Where next?
We’ve seen how quickly the AI landscape changes and how debugging with AI is no different. We’ve gone from asking chat interfaces to figure out error messages, to dedicated services like CodeRabbit and Sentry Seer that exist to automatically review code, find bugs, and most importantly, help fix them.
If you’re just getting started building your AI developer workflow, I’d recommend starting out with a simple back-and-forth conversation with a chat interface. Once you’re more comfortable and you’re settled on an AI-enabled IDE, start to bring the discussion into the context of your application to speed up how quickly you can solve bugs during development. As a final step, automate the CI process of code review and bug fixing with the various services dedicated to this.
And most importantly, build quality software as a result.